As mentioned previously, my goal wasn’t to just create a home controller/dashboard but to also collect as much data as possible while doing so. So tonight, I started playing around with a few different visualizations of the data I’ve collected thus far. It took a few hours but I’m satisfied with the current state.
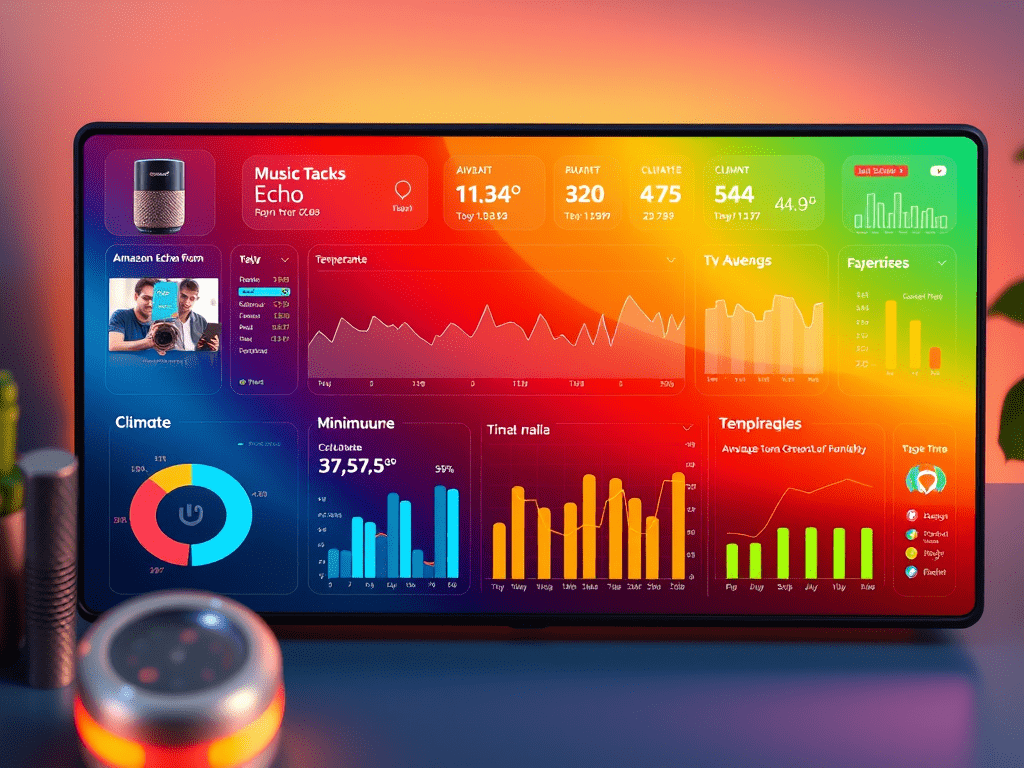
I’m doing simple dumps of the most recent music played by my Amazon Echo; most recent programming watched via DirecTv; visualizing the daily average, minimum, and maximum temperature and humidity levels in my apartment; visualizing by hour of day the average, min, and max temperature for the current month vs the previous month; breaking down the amount of time I spend at home by day of week (and telling on myself that I like to leave work early on Fridays :)); and visualizing my TV watching habits by hour of day and day of week.
I recorded a video of this all and also included the DirecTv control demo at the end.
Discover more from Weekend Enthusiast
Subscribe to get the latest posts sent to your email.
3 responses to “Data Visualization and Demo”

What exactly is running on the pi? I’ve been dabbling in Home Assistant, but I am ignorant to the code and yaml files. I seriously did a LOT of youtube watching and trying, but its simply too much for me. I don’t know how U came across your blog, but I want EXACTLY what you have going on here. I seriously wish you could mentor me. Id PAY you to do my code lmao. I have a pi2, samsung smarthub, LIFX bulb, several tablet if like to use as frontends, directv dvr’s, IPcams, and want to expand!!
I think maybe you are using openhab?
Thanks – I’m glad you like my project. If you have specific questions, I can try to help. Most of the project is documented at a high level and without much detail in earlier posts. This will give you a general idea of how it all works.
I tried openhab but ditched it shortly after setting it up – I found it too clunky and overly cumbersome for the flexibility I desired. I couldn’t get the dashboard UI, data collection, and all-in-one experience I desired through OpenHab (or any of the other similar options I saw). So I decided to start from scratch and build custom.
The Pi is running apache with mysql and all of the sensors use python or php to engiage WiringPi (http://wiringpi.com/) for GPIO work or product APIs (documented in earlier posts for Wink Hub and SHEF). From there, the Pi pretty much functions as a dedicated server handling API calls and running a few cron jobs.
Leave a Reply